
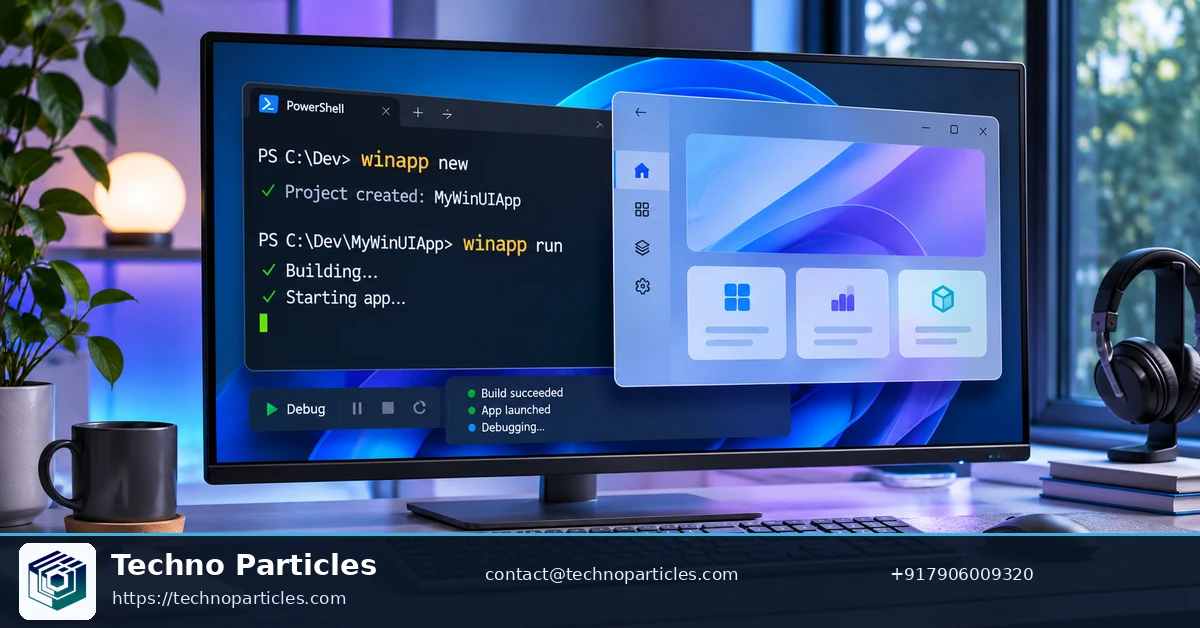
Windows App Development CLI 0.8: build and debug WinUI apps faster is the promise behind Microsoft’s latest tooling update. Version 0.8 brings visual inspection, performance profiling and support for existing Visual Studio C++ projects into a command-line workflow. These additions give developers more ways to investigate and package applications without relying entirely on an IDE; they do not establish an automatic improvement in application performance. Microsoft’s announcement describes the release.
| Version 0.8 addition | What it supports | Practical use |
|---|---|---|
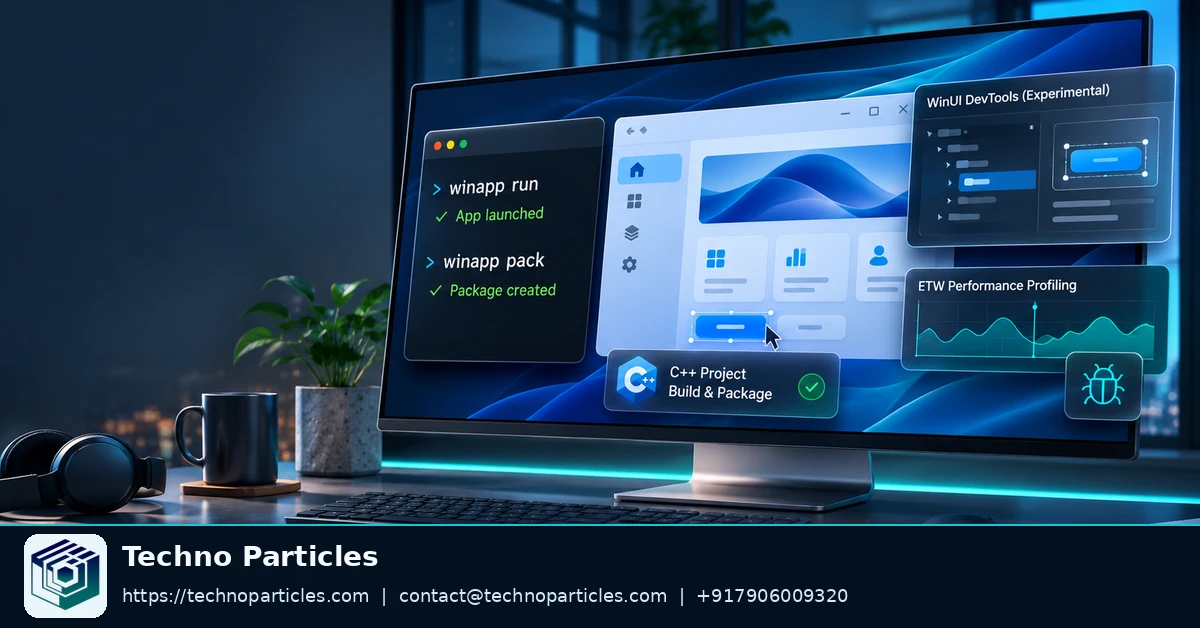
| WinUI DevTools | Visual-tree inspection and live property experiments | Connect a running control to its properties and source |
| ETW profiling | Terminal-based performance capture and analysis | Investigate startup and interaction costs |
| C++ project support | Build, run and MSIX packaging for .vcxproj projects | Use existing Visual Studio C++ projects in a CLI workflow |
Windows App Development CLI 0.8: build and debug WinUI apps faster
Microsoft’s GitHub release listing dates v0.8.0 to November 7, 2026; the Windows Developer Blog announcement followed on November 9. The distinction matters: the release entry records the version, while the announcement explains the developer workflows it introduces.
WinUI DevTools is designed to connect a control in a running app with its place in the visual tree and its source location. That can make an unfamiliar interface easier to navigate when investigating layout or property behavior. For teams planning application development, it also gives developers another way to inspect a Windows interface during implementation.
The release adds Event Tracing for Windows (ETW) profiling from the terminal and extends build, run and packaging support to Visual Studio C++ project files. Together, these features broaden the CLI’s role beyond launching an app: developers can inspect an interface, investigate performance and work with an existing C++ project from a terminal-oriented environment. Microsoft’s developer update, current as of November 10, 2026, also identifies these additions.
How WinUI DevTools changes the visual-debug loop
WinUI DevTools lets developers inspect a running interface as a hierarchy of elements rather than searching XAML files for a control by sight. Its visual tree exposes properties, bindings and layout details, while source-location information helps connect an element on screen to the code that defines it. Microsoft describes this workflow in its WinUI DevTools announcement.
The distinction between a control’s visible appearance and its place in the visual tree matters when several nested elements contribute to the same result. Inspecting the hierarchy can help a developer identify which element owns a property before changing the corresponding source. That is useful when implementing an interface from a prototype or investigating an issue raised during a UI and UX review.
Inspect, experiment and return to source
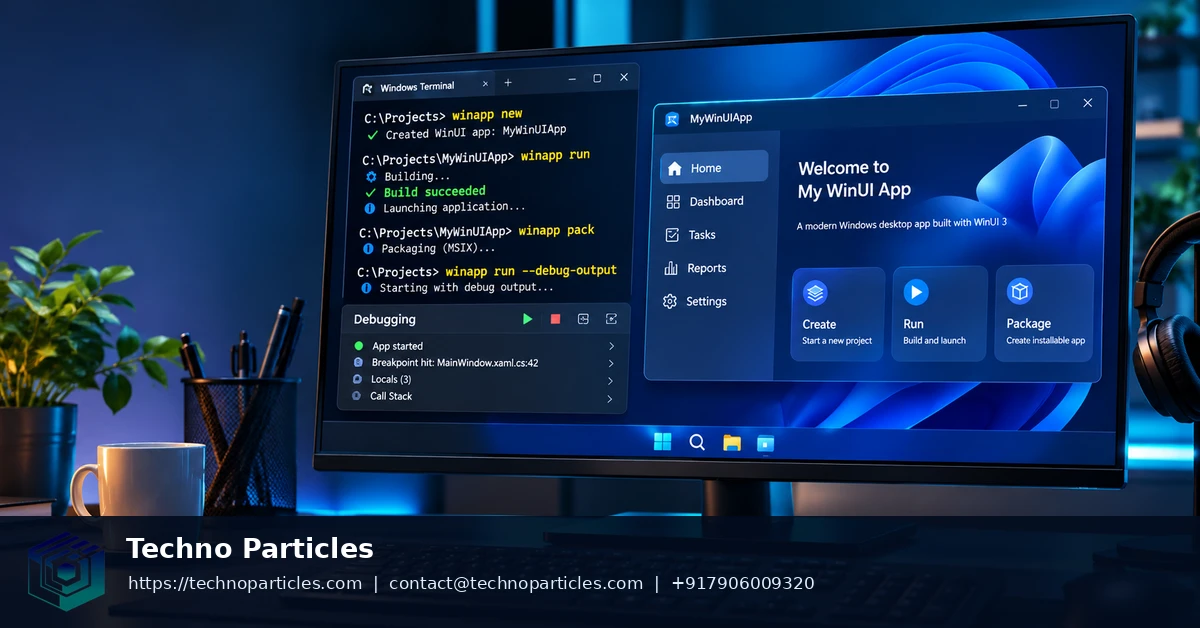
Microsoft documents commands for running an app, inspecting its interface and locating source. These commands represent separate steps in the workflow; the applicable arguments depend on what the developer wants to inspect:
winapp run .
winapp devtools inspect
winapp devtools get-source
DevTools also supports live property changes, so a developer can try an adjustment on a running element and observe the result before deciding whether to edit the project. These changes are temporary: they disappear after the app restarts. An experiment can also replace a binding for that run, so the observed behavior should be interpreted in that context.
Leave element-specific context for a coding agent
Comments can be saved against individual elements, giving a coding agent context tied to a particular part of the interface. The documented command below lists those comments:
winapp devtools comments listThat connection is useful when a visual issue is easier to identify on screen than to describe through a file name alone. The developer can use the element’s source location and associated comment to communicate where an intended change belongs.
Availability and setup for WinApp CLI 0.8
WinApp CLI is in public preview, and WinUI DevTools is an experimental preview feature. Microsoft’s CLI documentation describes support for WinUI alongside frameworks such as WPF, WinForms, .NET MAUI, Electron, Rust, Tauri and Flutter. Teams using more than one framework can assess the CLI against each project’s needs; the WinUI-specific setup below applies to WinUI projects.
Prepare a Windows development environment
For WinUI development, Microsoft lists Windows 10 version 1809 or later, or Windows 11, together with the WinApp CLI and Developer Mode. Its WinUI guide also specifies .NET SDK 8.0.100 or later. Check these prerequisites on the machine that will build and run the project before introducing the CLI into a team workflow.
The guide covers both C# and C++ WinUI projects. Teams can use it to create a project or work with an existing Visual Studio project, then follow the applicable instructions for running, debugging and packaging it. For a broader implementation plan, project consultation can help establish how a proposed workflow fits the project’s requirements.
Account for automated environments
WinUI DevTools does not start by default in CI environments or Windows Sandbox. That distinction matters when a team moves commands from a developer’s interactive machine into an automated environment: a workflow that opens inspection tools locally should not be assumed to behave identically there. Plan interactive inspection and automated build tasks as separate uses of the CLI.
The public-preview designation also means teams should allow for commands and features to change. Keep the documented setup accessible to everyone evaluating the tool, so developers can check the current prerequisites before reproducing a colleague’s workflow on another machine.
Build and package C++ WinUI projects from the terminal
For a team maintaining an existing Visual Studio C++ project, WinApp CLI 0.8 provides a way to launch and package the .vcxproj file directly from a terminal. The workflow uses MSBuild for the project and supports MSIX packaging, according to Microsoft’s v0.8 announcement. This gives developers a terminal entry point for an existing project without first recreating it as a different project type.
Run the existing project
Before building a C++ WinUI project, install Visual Studio or Build Tools with the Desktop development with C++ workload and the C++ WinUI app development tools. Microsoft’s WinUI guide describes these requirements and the workflow for existing projects.
From the project directory, replace the example filename with the actual project file and use the documented run command:
winapp run .\MyApp.vcxprojRunning through the CLI gives the app package identity for development. Package identity matters to Windows features that expect an app to have an identity, so it is relevant when a feature behaves differently during development than it does in a packaged app.
Create an MSIX package
Microsoft also documents a packaging command that specifies a Release configuration, an x64 architecture and a certificate file:
winapp pack .\MyApp.vcxproj -c Release --arch x64 --cert .\devcert.pfxThe certificate in this example is a development certificate for local testing. Distribution requires signing that recipients can trust; a local development certificate alone does not establish that trust. Choosing the signing approach is therefore part of the release process for a Windows application, alongside the implementation and testing work described in the application development services overview.
How to measure whether the faster workflow helps
ETW profiling gives a team evidence about where a WinUI app spends time during startup or interaction. Microsoft’s v0.8 announcement describes terminal-based recording and analysis that connects process resource usage with UI-thread activity and .NET garbage-collection context. That makes it possible to investigate a reported pause in terms of the work occurring around it, rather than assuming every delay has the same cause.
Connect a delay to the work on the UI thread
The analysis can show XAML parsing, layout, elements and frame intervals. For example, if a screen takes noticeably longer to appear, parsing and layout views can help a developer identify which phase deserves closer examination. A different interaction might show activity around managed garbage collection, suggesting a different area to investigate. These observations are starting points for diagnosis, not proof that a particular change will improve the experience.
Frame intervals and UI-thread timings also have boundaries: they do not measure GPU execution or the frame rate actually displayed to a user. Treat them as evidence about the recorded thread’s work, and use an appropriate additional measurement when the question concerns graphics execution or displayed frames.
Capture the scenario that matters
Profiling runs locally. A recording can miss the earliest startup activity unless elevated capture is enabled; elevated recording requires administrator approval. Choose the capture approach around the question: an interaction after launch can be examined in an ordinary session, while an investigation of the first moments of startup needs the appropriate elevated capture.
For a practical comparison, record the same representative action before and after a focused change, then compare the relevant parsing, layout or resource-usage observations. Keep the project and scenario consistent enough that the difference is meaningful. This kind of evidence can inform implementation and testing choices described in the application development services overview, while leaving the team to judge whether the observed result matters for its own application.
Decision rule for adopting WinApp CLI 0.8
Choose Windows App Development CLI 0.8: build and debug WinUI apps faster when terminal or coding-agent control fits your team’s workflow; keep your existing IDE workflow if interactive IDE debugging is central. As a next step, try the documented setup on one non-critical WinUI project and compare the friction your team experiences in its everyday development loop.


Leave a comment
Your email stays private. You can see your comment immediately on this browser. Others see it after approval.