
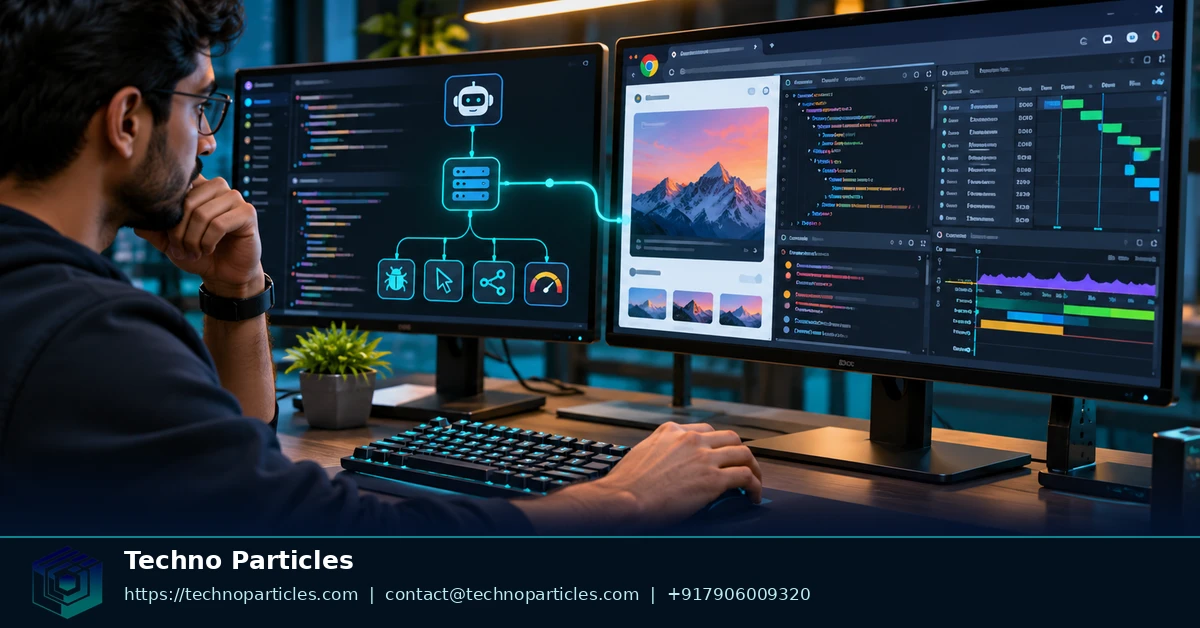
Knowing how to set up Chrome DevTools MCP for AI coding agents can give an MCP-compatible assistant a direct view of a running browser. Instead of relying only on source code, the agent can inspect browser behavior, examine network and console activity, and use performance traces to investigate a page. The Chrome for Developers launch announcement describes how the connection brings DevTools capabilities into an agent’s workflow.
For teams working on a website, that browser context can help connect a reported problem to what actually happens in the page. It also gives an agent a way to check changes in the environment where users see them; website development services cover the broader work of building and maintaining such sites.
| Milestone | What the official announcement described |
|---|---|
| September 23, 2025 | Public preview of Chrome DevTools MCP for connecting coding agents to browser debugging tools. |
| June 2, 2026 | Chrome’s DevTools update reported that the MCP server and CLI had become officially stable. |
| November 11, 2026 | The v1.13.0 release listed logpoints, page-scoped network mocks, and upstream network mock responses. |
What changed in Chrome DevTools MCP
Google introduced the server in public preview on September 23, 2025, describing a bridge between coding agents and Chrome DevTools. Its examples included inspecting layouts, diagnosing network and console issues, and recording performance traces. That made browser evidence available within an agent’s development workflow rather than requiring every observation to be relayed manually.
The Chrome 149 DevTools update, published June 2, 2026, said the MCP server and command-line interface had reached official stability. It also described capabilities available through v1.1.1, including third-party tools, WebMCP debugging, and custom HTTP-header emulation.
More recently, the ChromeDevTools releases page lists v1.13.0 on November 11, 2026. Its listed additions include logpoints and network mocking scoped to a page, giving developers further ways to observe code and control network responses during debugging.
Prerequisites and first installation
Before connecting an agent, install Node.js LTS and npm, and make sure you have a current stable version of Chrome. You also need a coding agent that supports the Model Context Protocol (MCP). The Chrome DevTools for agents setup guide lists these prerequisites and provides instructions for several supported clients.
The server is publicly available through its ChromeDevTools repository and can be started with npx. The official materials do not specify a paid plan, usage credits, or a per-user quota. The @latest tag selects the current package release, so the version it installs can change over time.
Add the server to Codex
For Codex, run the following command in a terminal:
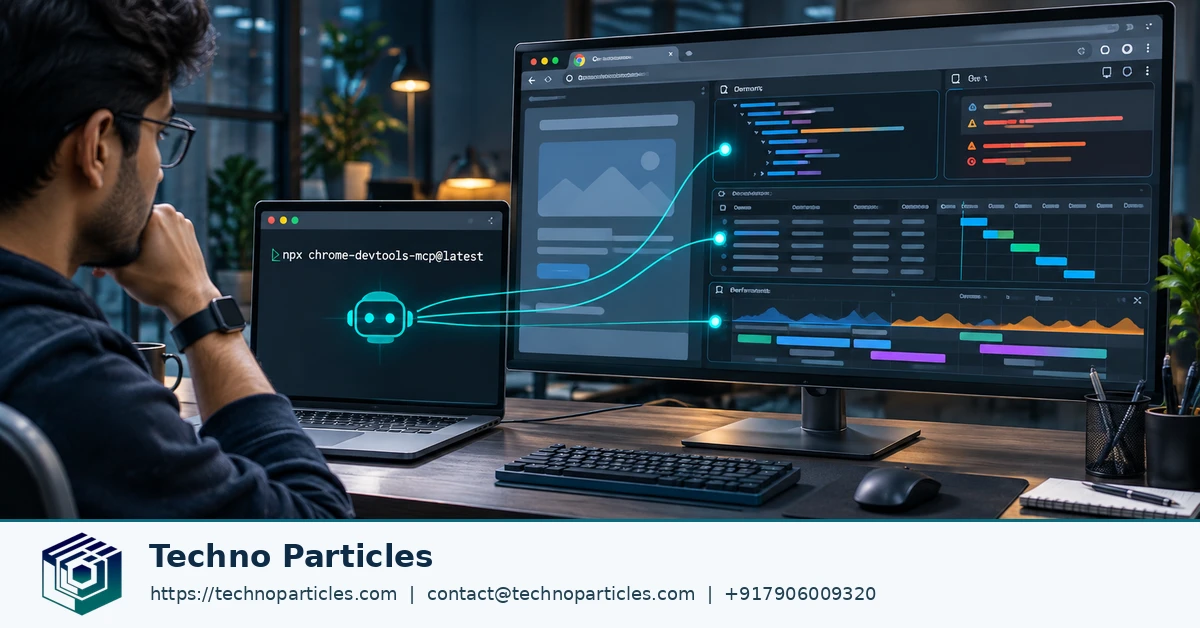
codex mcp add chrome-devtools -- npx -y chrome-devtools-mcp@latestThis registers an MCP server named chrome-devtools with Codex. The command tells the client to use npx to start the package; it does not require you to build the server from source. Once registered, the server makes its browser tools available to the agent through the MCP connection.
Configure a JSON-based client
For a client that accepts an mcpServers configuration, the official setup uses this entry:
{
  "mcpServers": {
    "chrome-devtools": {
      "command": "npx",
      "args": ["-y", "chrome-devtools-mcp@latest"]
    }
  }
}
Add the entry in the location required by your client. The same server can support different coding workflows, while the client determines how its configuration is stored and loaded. For teams assessing how an agent fits into a broader application, generative AI services describe related application and workflow capabilities.
Choosing a browser connection mode
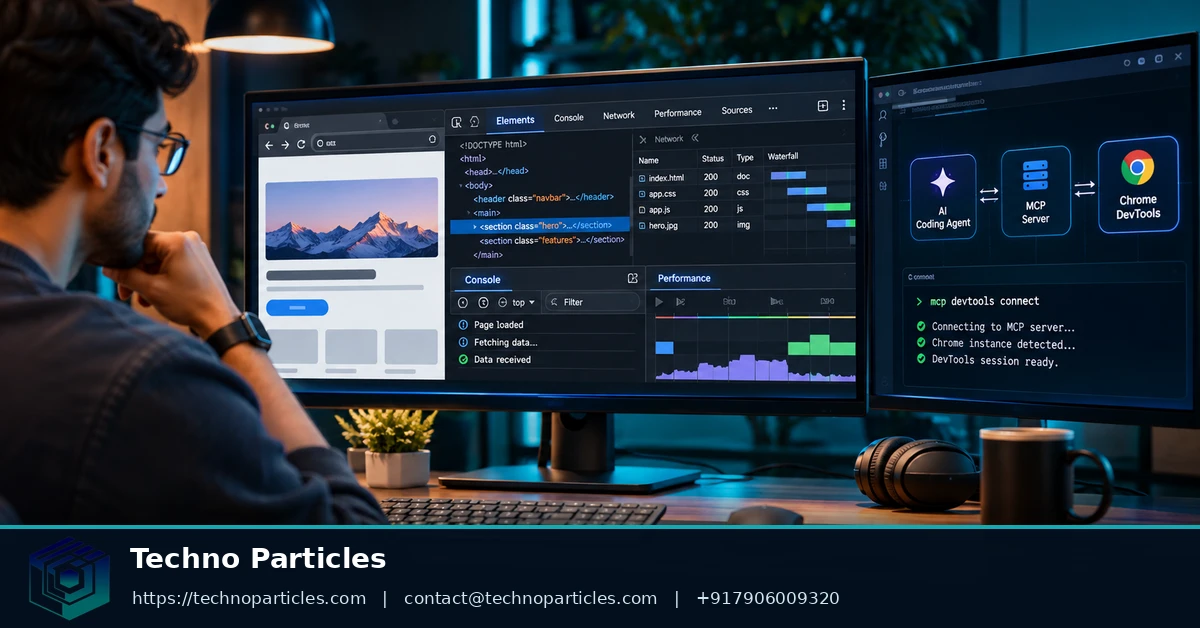
Chrome DevTools MCP can launch its own browser or connect to one that is already running. The choice determines which browser state the agent can work with and whether a separate Chrome process must be prepared. This distinction also matters when investigating a browser-based application during application development.
Let the server launch Chrome
With the standard configuration, the server starts Chrome when an agent first needs a browser tool. It uses a dedicated profile, giving the agent a browser environment separate from the profile you normally use. The advanced usage guide explains how the server manages its browser profile and routes pages during concurrent sessions.
For a disposable environment, add --isolated to the server arguments. This is useful when a task should begin without relying on an existing profile. The configuration documentation describes isolated mode alongside the other browser options.
Connect to an existing browser
When a task depends on browser state that already exists, --autoConnect can connect the server to a running Chrome instance. The advanced usage guide specifies Chrome 144 or later and explains the remote-debugging setup needed for this connection. Add the option to the existing server arguments, for example:
{
  "mcpServers": {
    "chrome-devtools": {
      "command": "npx",
      "args": ["-y", "chrome-devtools-mcp@latest", "--autoConnect"]
    }
  }
}
An alternative is --browser-url, which points the server to a separately managed browser's debugging endpoint. The documented example uses http://127.0.0.1:9222. This approach can suit environments where Chrome is started outside the MCP server or where a sandbox separates the agent from the browser. Unlike automatic connection, it requires the endpoint to be prepared and supplied explicitly.
Verify the setup in a coding workflow
After configuring the server, ask your coding agent to check a page’s performance. The official setup guide uses a performance-trace request as a verification prompt. Give the agent a page you can access, such as a local development page, and ask it to record a trace and explain its findings.
A successful check gives you more than confirmation that the configuration was accepted: it shows that the agent can invoke a browser tool and work with the resulting information. The agent’s explanation is a starting point for investigation; inspect the trace and relevant code before treating its interpretation as the cause of a performance issue.
Move from a trace to a specific question
Once the connection works, give the agent a focused task tied to the behavior you want to understand. For example, after a page renders slowly, ask it to inspect the performance trace and identify the activity associated with the delay. If a button appears to do nothing, ask it to interact with the page and inspect the console and network activity around that action.
The Chrome DevTools MCP announcement describes browser interaction, performance tracing, and network and console debugging as ways an agent can investigate a live page. These observations can connect a reported symptom to browser behavior, while the developer decides which code change is appropriate.
Check a visual change in context
For a layout change, ask the agent to open the affected page, inspect its rendered state, and capture a screenshot. Compare the result with the intended design and the relevant code. A screenshot can reveal an obvious visual difference, while inspecting the page can help explain which element or style produced it.
For teams working from prototypes or design systems, the UI/UX services page describes related design and developer-handoff work. A browser check can help connect those design decisions to the interface actually rendered by the application.
Privacy, compatibility, and configuration limits
Chrome DevTools MCP gives the connected agent access to browser content it can inspect, debug, and modify. That can include information visible in an authenticated session, so choose the account and pages you expose with the same care you would use when granting another person access. The project documentation describes this browser-content exposure. Access controls are also a consideration when integrating agents into wider workflows, as discussed on the generative AI services page.
Control what the server exposes
The server supports configuration flags for tool categories, allowing you to limit which groups of tools are available to the agent. The configuration reference documents these options and their effects. Select categories based on the work the agent needs to perform; a task that only requires inspecting a page may not need every available browser capability.
Usage statistics are enabled by default. The repository documents the --no-usage-statistics option for disabling them. This setting controls usage reporting; it does not change the agent’s ability to see content in the browser it is connected to.
Remote debugging also creates an access point to the browser. The advanced usage guide warns about the security implications, so restrict access to a debugging endpoint and avoid exposing it to untrusted users or networks.
Check browser and experimental-feature support
The project officially supports Google Chrome and Chrome for Testing; other Chromium-based browsers are not guaranteed to work. Experimental WebMCP tools are disabled by default and require Chrome 150 or later together with the documented --enable-features=WebMCP browser flag. Treat those tools as experimental when planning a workflow that depends on them.
Conclusion
When deciding how to set up Chrome DevTools MCP for AI coding agents, use the default dedicated browser profile for ordinary testing; choose an explicit connection mode when existing browser state or a sandbox boundary matters. After installation, run the performance-check prompt in the official setup guide.
Leave a comment
Your email stays private. You can see your comment immediately on this browser. Others see it after approval.